

Introduction: The Rise of Grid-Dependent Battery Storage
Motivations for Non-Solar Battery Systems
In 2025, home battery storage is no longer exclusive to solar owners. Rising grid electricity costs (e.g., 5–8% annual increases in OECD countries), volatile energy markets, and the need for backup power drive adoption among households reliant solely on the grid. These systems serve as energy arbitrage tools, leveraging time-of-use (TOU) pricing, demand charge management, and grid services to reduce expenses while enhancing reliability. For example, a U.S. household spending $2,000/year on electricity can save 20–30% with a well-designed battery strategy, even without solar.
Key Objectives
Cost Reduction: Exploit price differences between off-peak and peak electricity rates.
Reliability Enhancement: Ensure backup power during outages, especially for critical loads.
Grid Service Participation: Earn revenue by providing frequency regulation or peak shaving to utilities.
Market Context (2025 Trends)
TOU Pricing Adoption: Over 60% of U.S. utilities and 80% of EU utilities now offer dynamic pricing plans.
Battery Cost Decline: Lithium-ion battery prices have fallen to \(150–\)200/kWh (pack level), making 10 kWh systems affordable at \(3,000–\)5,000 after incentives.
Policy Support: Many regions offer rebates for non-solar storage (e.g., Japan’s $900/kWh subsidy for emergency storage).
System Design Fundamentals: Sizing and Components
1. Energy and Power Requirements
Load Analysis
Daily Energy Consumption (kWh): Start with 12–18 months of utility bills to calculate average daily usage. Categorize loads:
Critical: Refrigerator (200 W × 24h = 4.8 kWh), medical devices (1 kWh), lighting (2 kWh) → total ~8 kWh/day.
Non-Critical: HVAC (5 kW × 4h = 20 kWh), EV charging (10 kWh/day) → varies by usage.
Peak Power (kW): Determine the highest simultaneous load (e.g., HVAC + EV charging = 15 kW).
Battery Sizing Formulas
Energy Capacity (kWh):
For TOU arbitrage: 1.5–2× daily critical load to cover peak periods (e.g., 8 kWh critical × 2 = 16 kWh battery).
For backup: 3–5 days of critical load (e.g., 8 kWh/day × 3 = 24 kWh).
Power Rating (kW): Must exceed peak critical load (e.g., 5 kW for a home with 4.5 kW critical peak).
2. Battery Technology Selection
Technology
Cost ($/kWh)
Cycles
Depth of Discharge (DoD)
Ideal Use Case
LFP Lithium-Ion
300–400
4,000+
80–90%
Long-term TOU arbitrage
Lead-Acid (AGM)
150–200
500–1,000
50–70%
Budget backup systems
Flow Batteries
500–600
10,000+
100%
Ultra-long lifespan (10+ years)
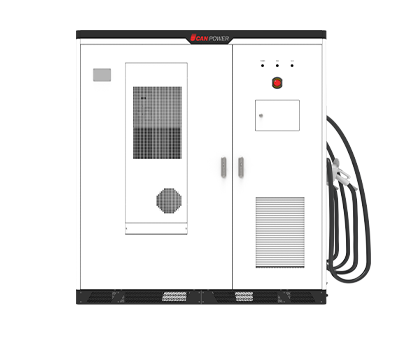
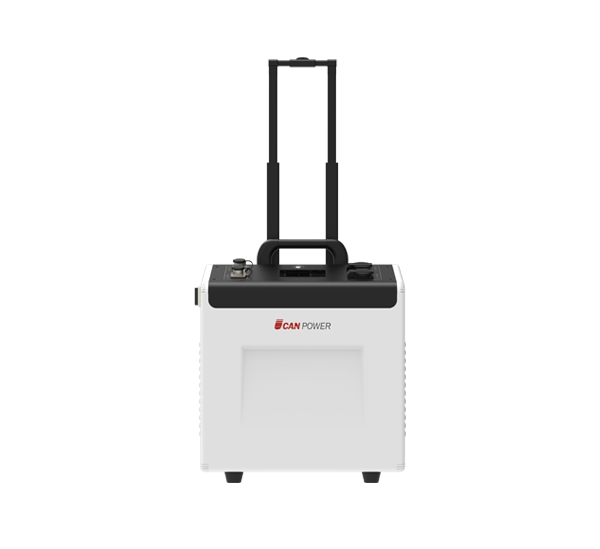
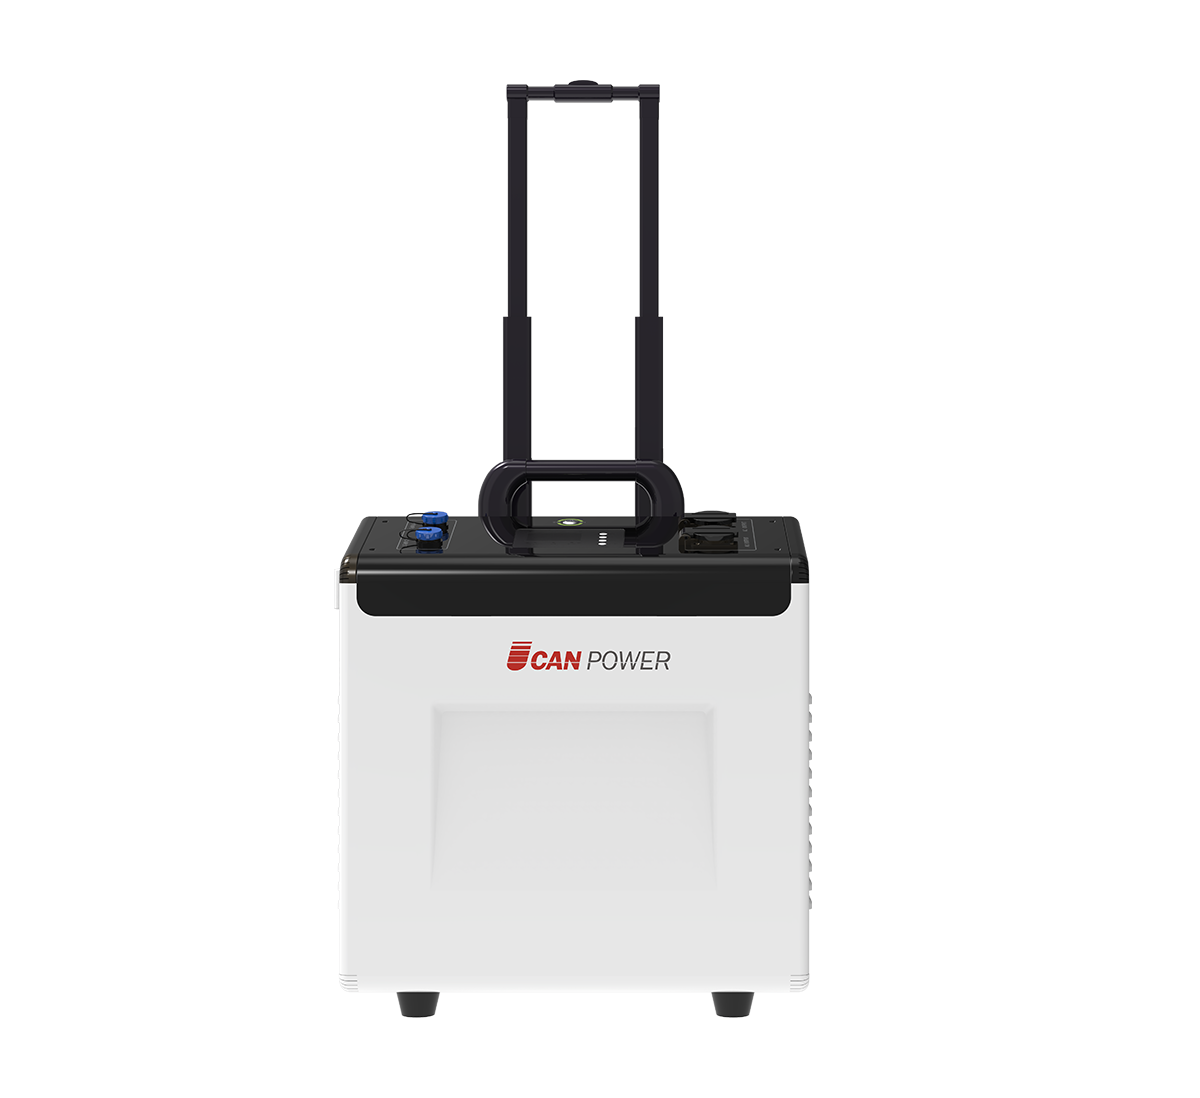
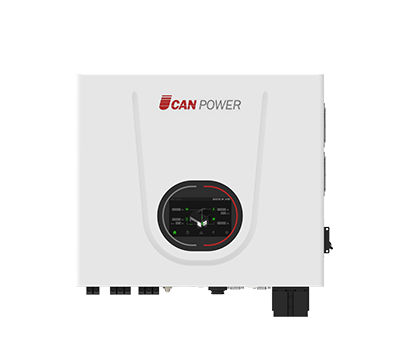
Example: A 10 kWh LFP battery (e.g., Bluetti AC300) costs $3,500, supports 5 kW continuous discharge, and suits a household targeting TOU savings with 5 years of daily cycling.
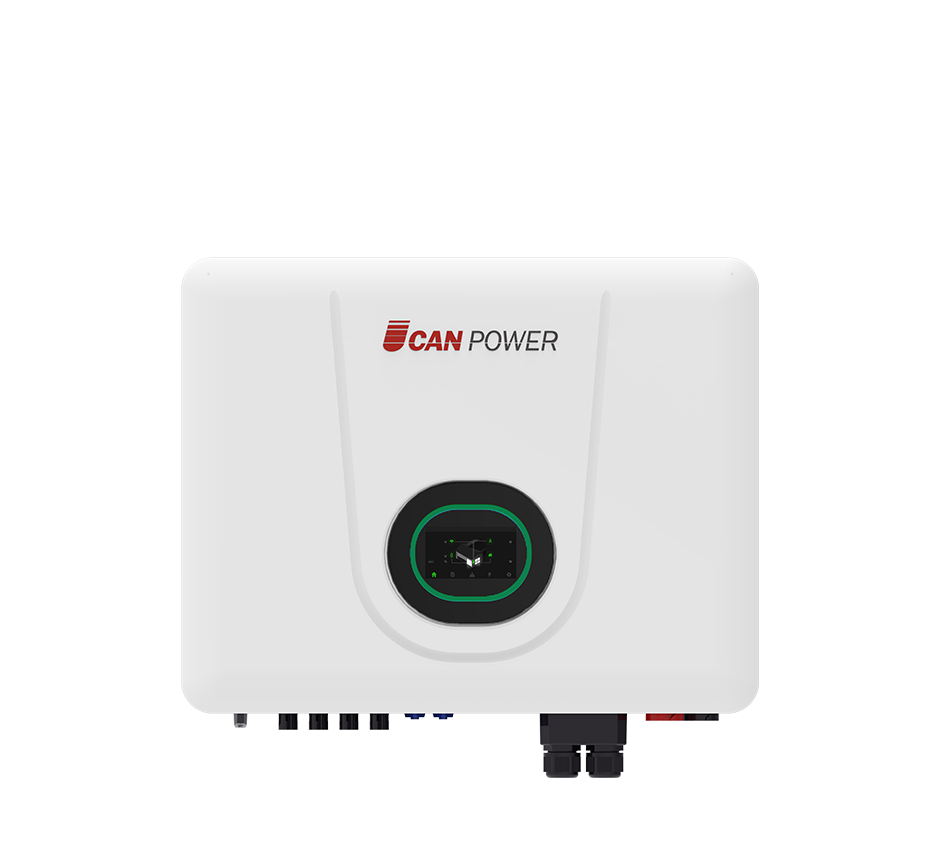
3. Inverter and Grid Connection
Bidirectional Inverters: Required for grid charging/discharging. Look for:
2–5 kW capacity (matching peak load).
Smart grid compatibility (e.g., OpenADR 2.0 for TOU signals).
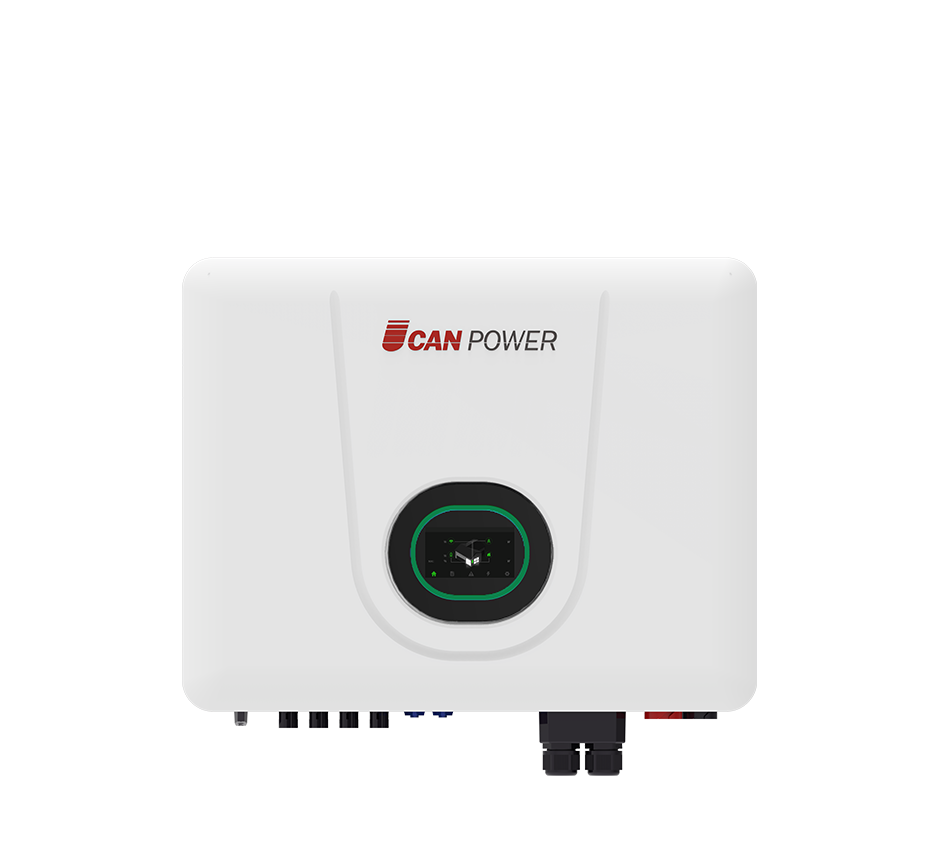
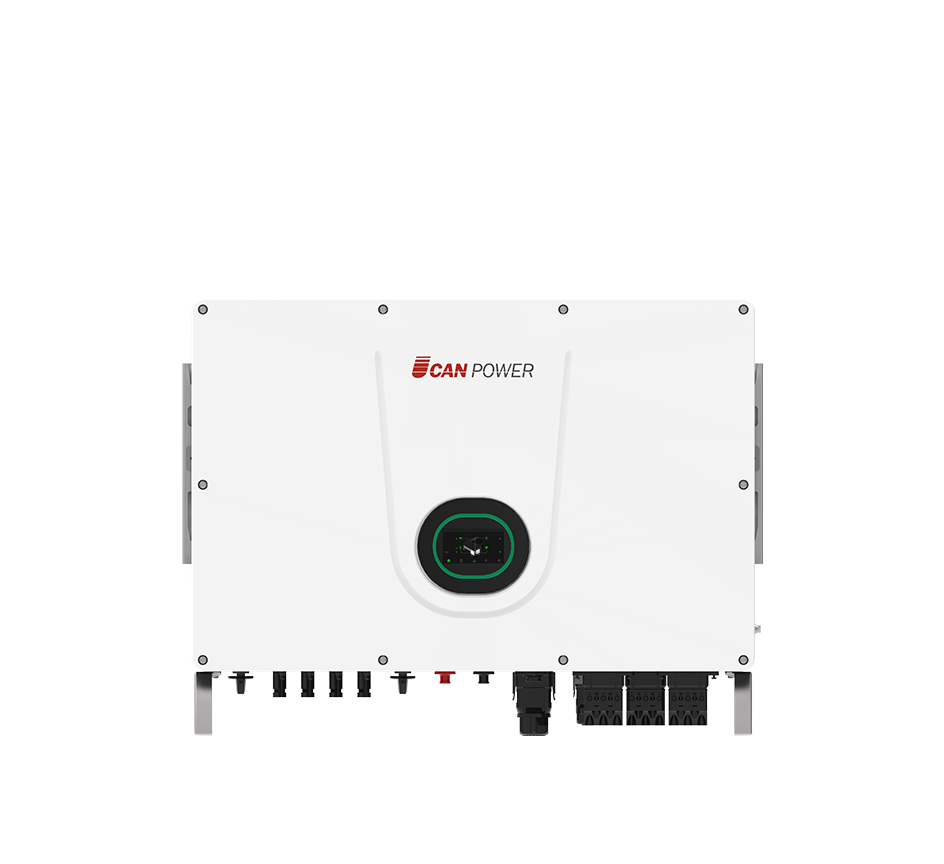
Models: Sol-Ark 12k (12 kW hybrid inverter, $3,800).
Transfer Switch: Isolates the system during outages. 电子式 switches (e.g., Generac RTX) offer <100ms transfer times.
Core Grid Power Purchase Strategies
Strategy 1: Time-of-Use (TOU) Arbitrage
How It Works
Off-Peak Charging: Charge batteries during low-rate periods (e.g., midnight–5 AM) when prices are 30–50% lower than peak.
Peak Discharging: Use stored energy during high-rate periods (e.g., 4–9 PM) to avoid grid imports.
Mathematical Model
Daily Savings = (Peak Rate Off-Peak Rate) × Energy CycledExample:
Peak rate: \(0.30/kWh, Off-peak: \)0.12/kWh.
Daily cycling: 10 kWh (charged at off-peak, discharged at peak).
Daily savings: (\(0.30 \)0.12) × 10 = \(1.80 → \)657/year.
Implementation Tips
Rate Plan Selection:
Choose TOU plans with ≥2× peak/off-peak 价差. In California’s TOU-D plan, peak rates (\(0.45/kWh) are 3× off-peak (\)0.15/kWh).
Charge Scheduling:
Use inverter apps (e.g., Victron Energy) to automate charging between 12 AM–5 AM.
Load Shifting:
Shift non-critical loads (e.g., EV charging, laundry) to off-peak hours to maximize battery discharge during peak.
Challenges
Battery Degradation: Daily 80% DoD cycling reduces LFP battery lifespan from 10 to 7 years. Mitigate by limiting DoD to 50% for moderate savings.
Rate Plan Changes: Utilities may revise TOU windows; opt for plans with fixed peak hours (e.g., PG&E’s Summer Peak: 4–9 PM).
Strategy 2: Demand Charge Management
Who Needs This?
Households with high peak demand (e.g., >10 kW) due to EVs, HVAC, or appliances. Demand charges (typically \(10–\)30/kW/month) can account for 30% of bills in commercial-like residential rates (e.g., TOU-D for large homes in the U.S.).
Mechanism
Use batteries to cap peak demand at a predefined threshold (e.g., 8 kW). Excess load is met by battery discharge instead of grid import.
Example Calculation
Current Peak Demand: 12 kW, Demand Charge: $15/kW/month.
Target Peak: 8 kW, Reduced Demand: 4 kW.
Annual Savings: 4 kW × \(15/month × 12 = \)720/year.
Control Algorithms
Threshold Control: Inverters reduce grid import to ≤8 kW by discharging batteries.
Predictive Load Forecasting: AI models (e.g., Sense Energy) predict peak loads 1 hour ahead, preemptively charging batteries.
Hardware Requirements
High-power batteries (≥10 kW peak discharge) and fast-responding inverters (e.g., SMA Sunny Boy Storage 10.0).
Strategy 3: Backup Power Optimization
Designing for Outages
Critical Load Identification: List appliances to power during outages (e.g., refrigerator, Wi-Fi, medical devices). Calculate total wattage and runtime:
Refrigerator (200 W) + CPAP (120 W) + LED lights (50 W) = 370 W.
10 kWh battery at 50% DoD = 5 kWh available. Runtime: 5,000 Wh / 370 W ≈ 13.5 hours.
Grid Charging Before Outages: Use weather alerts to pre-charge batteries to 100% when outages are forecast.
Cost vs. Reliability Tradeoff
Small Systems (5–10 kWh): Cover critical loads for 8–24 hours, ideal for short outages.
Large Systems (20+ kWh): Support whole-home backup but require higher investment ($10,000+).
Utility Backup Programs
Some utilities (e.g., Duke Energy) offer \(50–\)100/month credits for the use of backup batteries during emergencies, offsetting 10–15% of system costs.
Strategy 4: Grid Service Participation
Virtual Power Plants (VPPs)
Aggregators like Powin Energy or Enel X pool residential batteries to provide grid services:
Frequency Regulation: Earn \(5–\)15/MWh by rapidly adjusting power output to stabilize grid frequency.
Peak Shaving: Utilities pay \(20–\)50/MWh to discharge batteries during grid stress.
Example: A 10 kWh battery participating in VPP frequency regulation can earn \(200–\)300/year in the PJM market.
Requirements
Grid-forming inverters (compatible with IEEE 1547-2018).
Communication modules for real-time dispatch (e.g., cellular or Ethernet).
Risks
Reduced control over battery usage during VPP events (e.g., inability to use stored energy for personal peak periods).
Economic Analysis: Costs and Returns
Initial Investment Breakdown (2025)
Component
Cost Range
10 kWh LFP Battery
\(3,000–\)4,500
5 kW Inverter
\(1,500–\)2,500
Installation
\(1,000–\)1,800
Total
\(5,500–\)8,800
Incentives
U.S. Federal Tax Credit: 30% credit for standalone storage (\(1,650–\)2,640 savings).
Japan’s Emergency Storage Subsidy: ¥120,000 ($800) for 5 kWh systems.
Germany’s Stromspeicherzulage: €0.50/Wh (\(0.54/Wh) for systems ≥4 kWh (\)2,160 for 10 kWh).
Ongoing Costs
Battery Replacement: \(3,000–\)4,500 every 7–10 years (LFP).
Electricity for Charging: ~\(0.12/kWh × 10 kWh/day × 365 = \)438/year (off-peak rate).
ROI Scenarios
Scenario 1: TOU Arbitrage Only
Annual Savings: $657 (as above).
Net Cost: \(8,800 \)2,640 (tax credit) = $6,160.
Payback Period: \(6,160 / \)657 ≈ 9.4 years.
Scenario 2: TOU + Demand Charge
Annual Savings: \(657 (TOU) + \)720 (demand) = $1,377.
Payback Period: \(6,160 / \)1,377 ≈ 4.5 years.
Scenario 3: TOU + VPP
Annual Savings: \(657 + \)250 (VPP) = $907.
Payback Period: ~6.8 years.
Technical Integration and Best Practices
1. Smart Metering and Control
Dynamic Load Management: Use smart plugs (e.g., TP-Link Kasa) to prioritize critical loads during battery discharge.
Real-Time Monitoring: Apps like MyEnergi or SolarEdge’s monitoring dashboard track SoC, grid imports/exports, and savings in real time.
2. Grid Code Compliance
Anti-Islanding Protection: Inverters must detect grid outages within 2 seconds and disconnect to prevent worker hazards.
Reactive Power Support: Some grids require batteries to provide vars (e.g., 0.9 power factor) during normal operation.
3. Safety and Maintenance
Indoor Installation: Use fireproof enclosures (UL 94 V-0 rated) and ensure 3 feet of clearance for ventilation.
Battery Maintenance: For lead-acid batteries, check water levels quarterly; for Li-ion, update firmware annually to optimize BMS performance.
Case Studies: Real-World Applications
Case 1: TOU Arbitrage in New York City
Setup: 12 kWh LFP battery, 5 kW inverter, TOU rates (\(0.10/kWh off-peak, \)0.35/kWh peak).
Strategy: Charge 10 kWh nightly at off-peak, discharge during 4–9 PM peak.
Outcomes:
Annual savings: (\(0.35 \)0.10) × 10 × 365 = $912.
Payback: 7 years (after $2,500 tax credit).
Case 2: Demand Charge Reduction in Texas
Setup: 20 kWh battery, 10 kW inverter, demand charge of $18/kW/month.
Strategy: Cap peak demand at 10 kW (down from 15 kW).
Outcomes:
Reduced demand: 5 kW × \(18 × 12 = \)1,080/year.
Combined with TOU savings ($800/year), payback in 5 years.
Case 3: Backup Power in Japan
Setup: 8 kWh lead-acid battery, 3 kW inverter, subsidized at ¥72,000 ($500).
Strategy: Pre-charge during typhoon alerts, power critical loads for 12 hours.
Outcomes:


 German
 Italian
 Japanese
 Global (English)
 Chinese
 Spanish
 French


